sdvplot

Team logos, wordmarks, headshots and colors for Python plots and tables.

Install and try it

pip install git+https://github.com/sportsdataverse/sdvplot
import sdvplot

sdvplot.resolve(["KC", "Kansas City Chiefs", 12], "nfl")
sdvplot.palette("nfl", teams=["KC", "SF"])
sdvplot.team_colors(["LAL", "BOS"], "nba")
sdvplot.team_colors("NYY", "mlb", which="secondary")
['12', '12', '12']
{'KC': '#e31837', 'SF': '#aa0000'}
['#552583', '#008348']
'#c4ced4'

These calls run offline against the team index bundled with the package. Getting started lists the extras.

What it draws
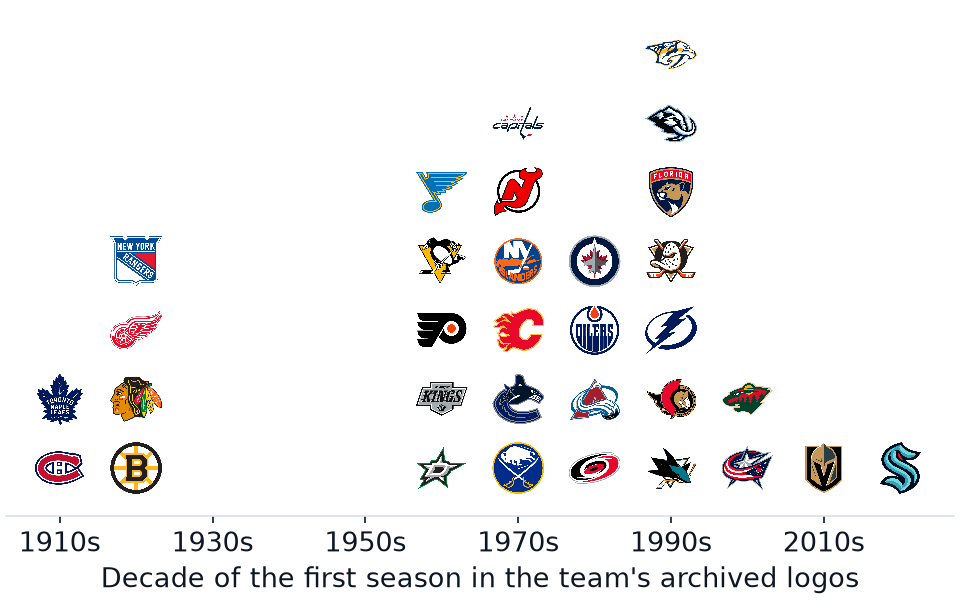
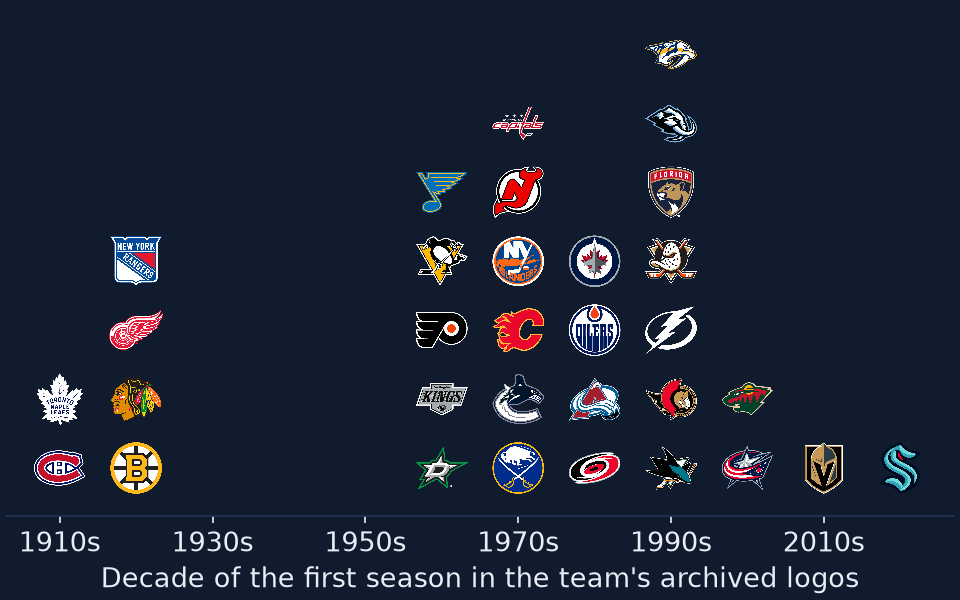
NHL team logos stacked by decade: 1910s: MTL, TOR; 1920s: BOS, CHI, DET, NYR; 1960s: DAL, LA, PHI, PIT, STL; 1970s: BUF, VAN, CGY, NYI, NJ, WSH; 1980s: CAR, COL, EDM, WPG; 1990s: SJ, OTT, TB, ANA, FLA, UTAH, NSH; 2000s: CBJ, MIN; 2010s: VGK; 2020s: SEA.NHL team logos stacked by decade: 1910s: MTL, TOR; 1920s: BOS, CHI, DET, NYR; 1960s: DAL, LA, PHI, PIT, STL; 1970s: BUF, VAN, CGY, NYI, NJ, WSH; 1980s: CAR, COL, EDM, WPG; 1990s: SJ, OTT, TB, ANA, FLA, UTAH, NSH; 2000s: CBJ, MIN; 2010s: VGK; 2020s: SEA.
add_logos() as scatter points: NHL teams, stacked by the decade their archived logos begin (marks()).
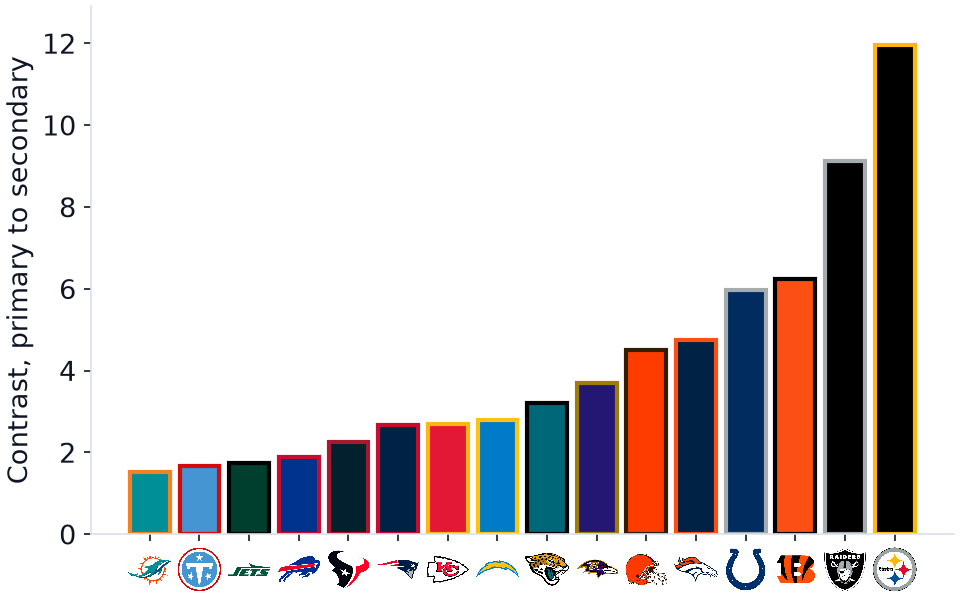
Bar chart of the contrast ratio between each AFC team's primary and secondary color, lowest first: MIA 1.5, TEN 1.7, NYJ 1.7, BUF 1.9, HOU 2.3, NE 2.7, KC 2.7, LAC 2.8, JAX 3.2, BAL 3.7, CLE 4.5, DEN 4.7, IND 6.0, CIN 6.2, LV 9.1, PIT 12.0.Bar chart of the contrast ratio between each AFC team's primary and secondary color, lowest first: MIA 1.5, TEN 1.7, NYJ 1.7, BUF 1.9, HOU 2.3, NE 2.7, KC 2.7, LAC 2.8, JAX 3.2, BAL 3.7, CLE 4.5, DEN 4.7, IND 6.0, CIN 6.2, LV 9.1, PIT 12.0.
Bars in each AFC team's two colors from palette(), their contrast ratio as the height, and axis_logos() on the axis.
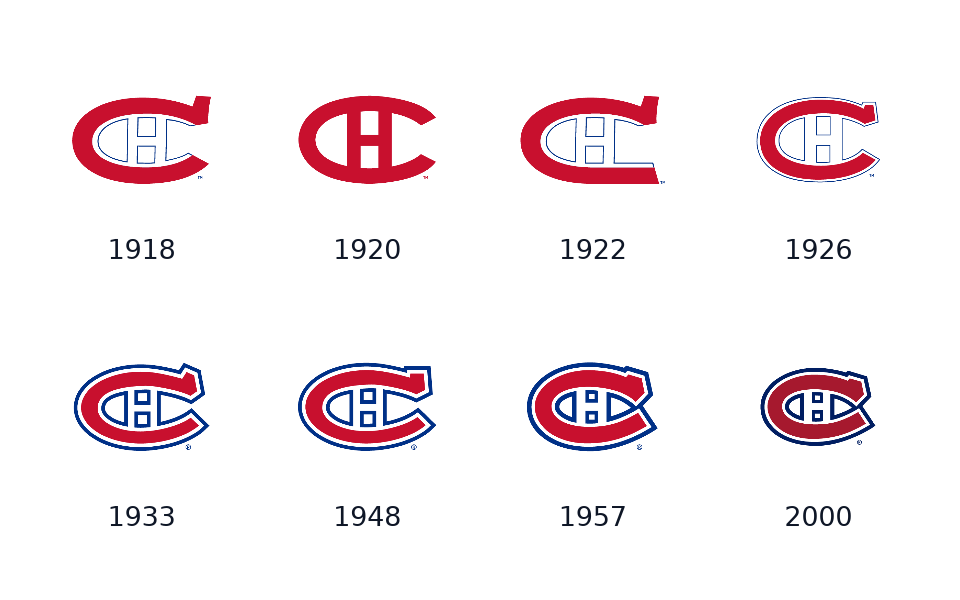
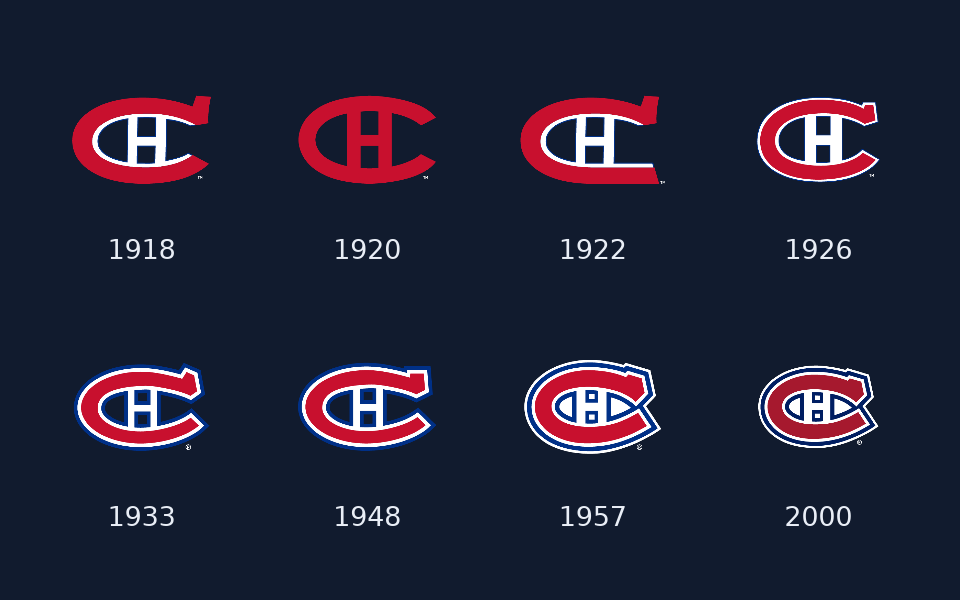
The 8 Montreal Canadiens logos in the archive, in order, first used in 1918, 1920, 1922, 1926, 1933, 1948, 1957, 2000.The 8 Montreal Canadiens logos in the archive, in order, first used in 1918, 1920, 1922, 1926, 1933, 1948, 1957, 2000.
One add_logos() call with season=: the mark Montreal used each season, from the logo archive.
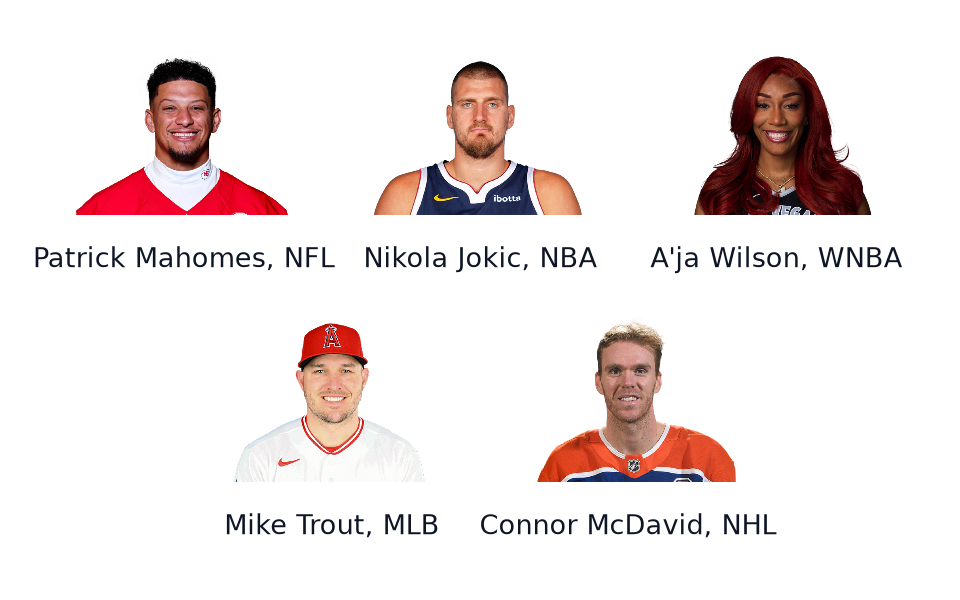
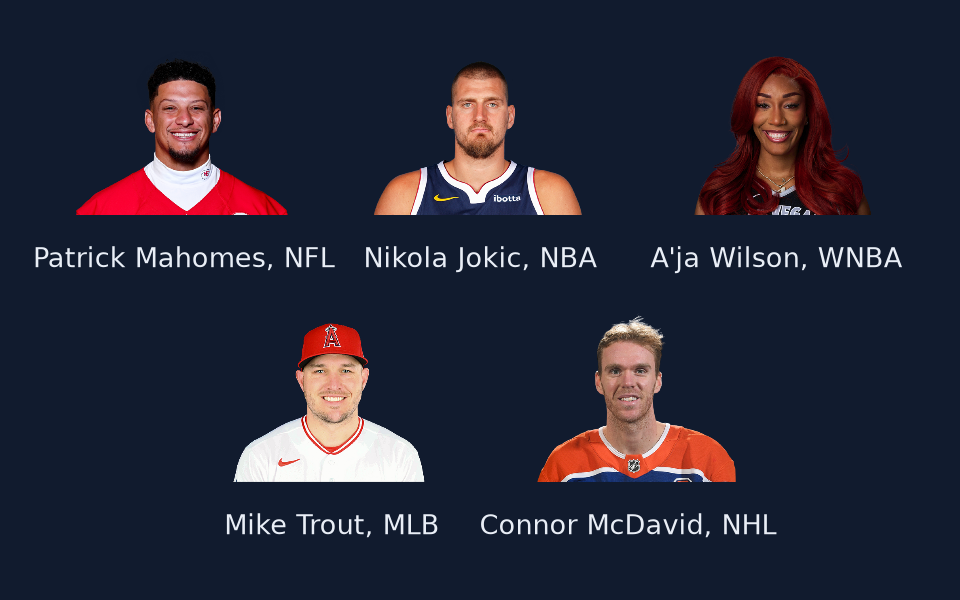
ESPN headshots of Patrick Mahomes (NFL), Nikola Jokic (NBA), A'ja Wilson (WNBA), Mike Trout (MLB), Connor McDavid (NHL).ESPN headshots of Patrick Mahomes (NFL), Nikola Jokic (NBA), A'ja Wilson (WNBA), Mike Trout (MLB), Connor McDavid (NHL).
add_headshots() with ESPN athlete ids, one player from each of five leagues.

Team colors from palette()

  • Kansas City ChiefsNFL#e31837 #ffb612
  • San Francisco 49ersNFL#aa0000 #b3995d
  • Los Angeles LakersNBA#552583 #fdb927
  • Boston CelticsNBA#008348 #ffffff
  • New York YankeesMLB#132448 #c4ced4
  • Los Angeles DodgersMLB#005a9c #ffffff

Any identifier

Pass the team ids you already have — ESPN ids, nflverse or FanGraphs abbreviations, CFBD names, nba_api ids, NHL codes — and sdvplot resolves them, season-aware, without ever guessing.

Logos for every era

Logos and wordmarks come from the SportsDataverse logo archive with season ranges, so the 2010 Raiders get the Oakland mark.

Team colors

palette() returns a plain {team: hex} mapping that seaborn, Plotly, Altair and Bokeh accept as-is.

Headshots

ESPN athlete ids for the NFL, NBA, WNBA, MLB, NHL and college football and basketball, and NFL gsis ids through the nflverse player table, matching sdvplotR.

pandas and polars

Scalars, lists, numpy arrays and pandas/polars Series in, the same container back — the pandas index kept.

Part of the SportsDataverse

The Python counterpart to sdvplotR, built on the same archive as sdv-py.