MLB
This page is regenerated every week by sdvplot's docs workflow. It builds the division standings, charts run differential with logos and lists the league leaders with their headshots, for the latest MLB season with games: the season to date from opening day to the end of September, the final regular season after that. Data: the MLB Stats API and ESPN, read through sportsdataverse-py; no key needed.
The season runs inside one calendar year, but before opening day the Stats API standings for the new season come back
empty or with no games played. The helper turns that into a NoDataError and the page steps back one season.
import datetime as dt

import matplotlib.pyplot as plt
import polars as pl
import sportsdataverse.mlb as mlb
from IPython.display import Markdown, display
from sportsdataverse.errors import NoDataError

import sdvplot

today = dt.date.today()
current = today.year
STATS_API = "Data: MLB Stats API via sportsdataverse-py"


def standings_for(season):
    table = mlb.parse_mlb_api_standings(mlb.mlb_standings(season=season, hydrate="division"))
    if table.is_empty() or table["games_played"].max() == 0:
        raise NoDataError(f"no {season} regular-season games yet")
    return table


try:
    season, standings = current, standings_for(current)
except NoDataError as err:
    print(f"{err}; showing {current - 1} instead")
    season, standings = current - 1, standings_for(current - 1)
The Stats API's season calendar (mlb_season) says whether the regular season is still being played, so the status
line can say what the numbers cover.
calendar = mlb.mlb_season(season_id=season).row(0, named=True)
regular_end = dt.date.fromisoformat(calendar["regular_season_end_date"])
post_end = dt.date.fromisoformat(calendar["post_season_end_date"])
if season < current:
    status = f"**Offseason:** the final {season} regular season; the {current} season has no games yet."
    through = "final regular season"
elif today <= regular_end:
    games = int(standings["games_played"].median())
    status = f"**Updated {today}:** the {season} season to date, about {games} games per team."
    through = f"through {games} games"
elif today <= post_end:
    status = f"**Updated {today}:** the final {season} regular season; the postseason is under way."
    through = "final regular season"
else:
    status = f"**Offseason:** the final {season} regular season."
    through = "final regular season"
display(Markdown(status))

clubs = mlb.parse_mlb_api_teams(mlb.mlb_teams(season=season)).select(pl.col("id").alias("team_id"), "abbreviation")
assert standings.schema["team_id"] == clubs.schema["team_id"]
standings = standings.join(clubs, on="team_id").select(
    "abbreviation",
    "team_name",
    division="standings_division_name",
    rank=pl.col("division_rank").cast(pl.Int64),
    w="wins",
    l="losses",
    pct="winning_percentage",
    gb="games_back",
    rs="runs_scored",
    ra="runs_allowed",
    diff="run_differential",
    strk="streak_streak_code",
)
standings.sort("division", "rank").head()
Updated 2026-10-05: the final 2026 regular season; the postseason is under way.
| abbreviation | team_name | division | rank | w | l | pct | gb | rs | ra | diff | strk |
|---|---|---|---|---|---|---|---|---|---|---|---|
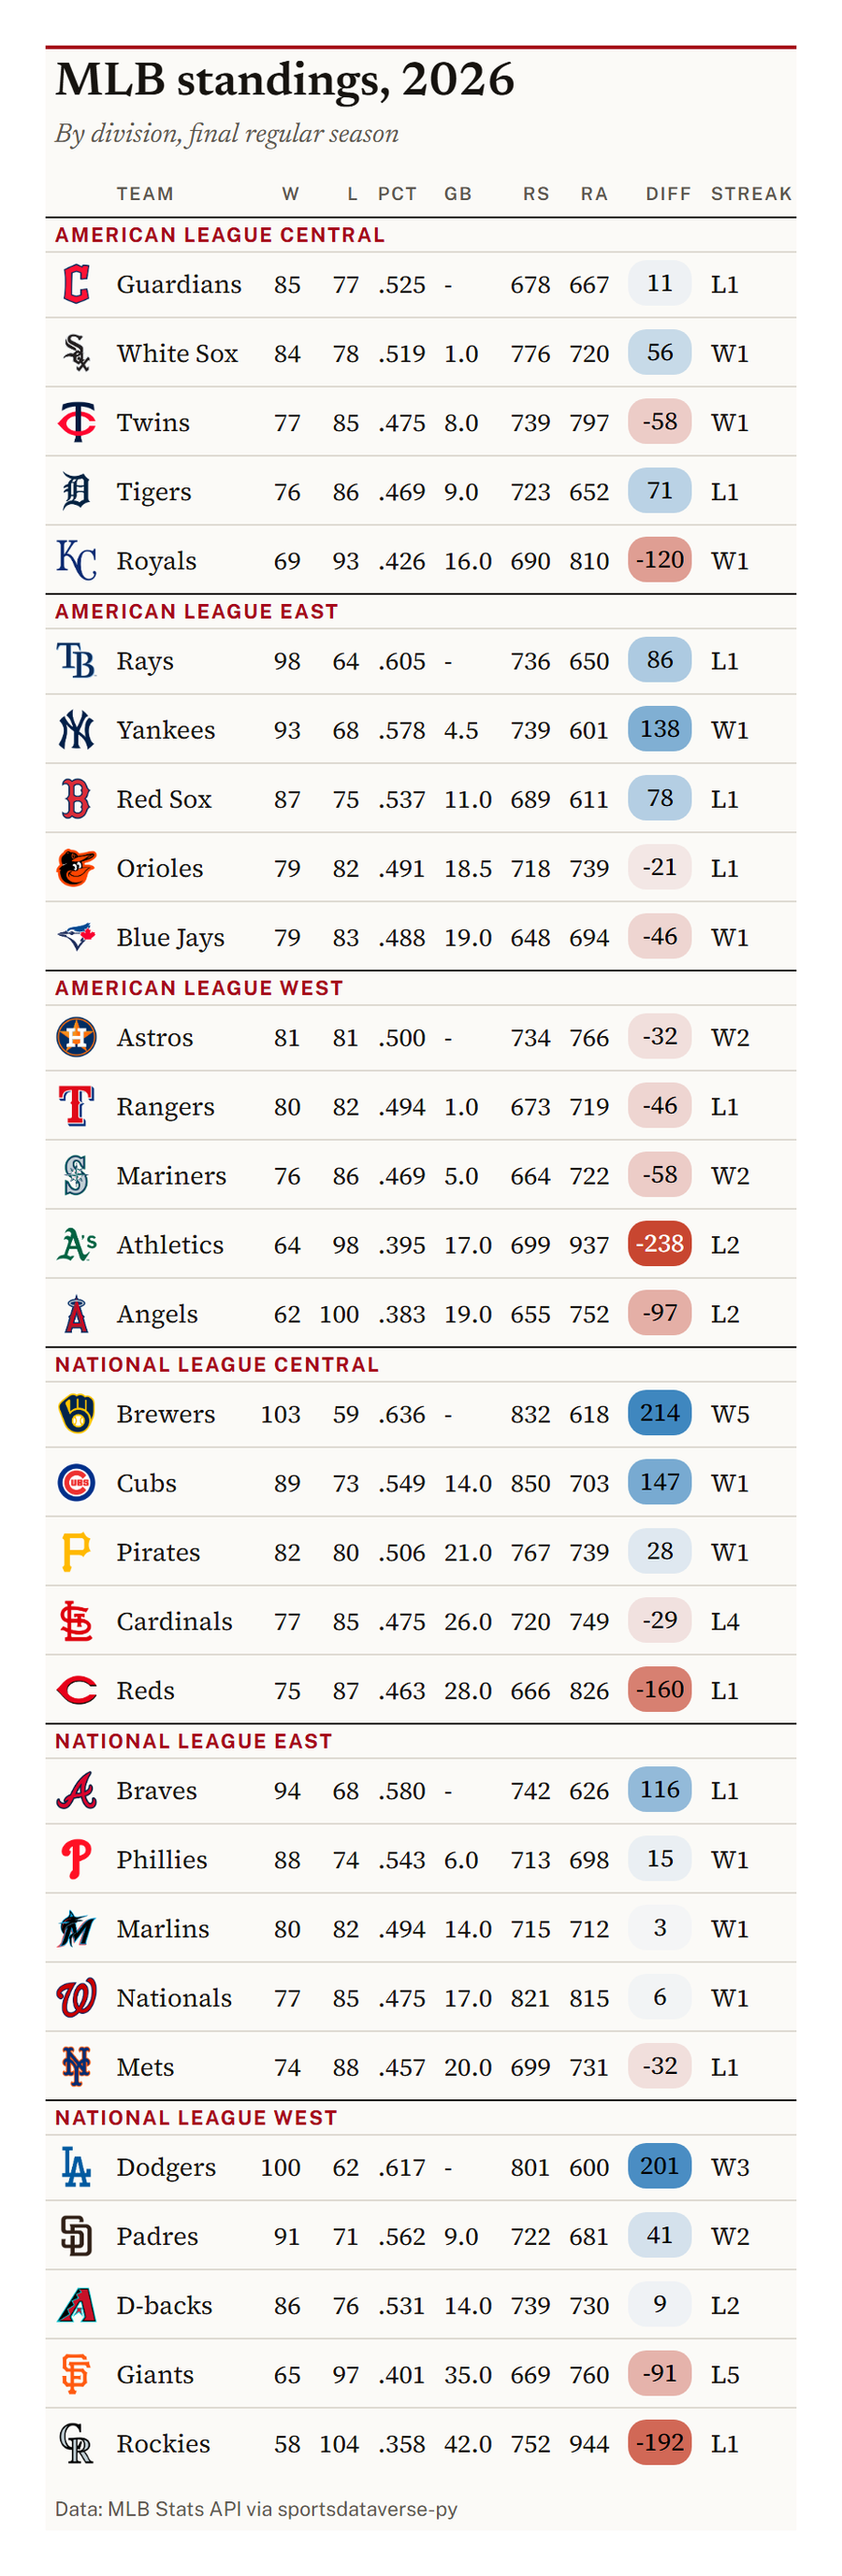
| CLE | Guardians | American League Central | 1 | 85 | 77 | .525 | - | 678 | 667 | 11 | L1 |
| CWS | White Sox | American League Central | 2 | 84 | 78 | .519 | 1.0 | 776 | 720 | 56 | W1 |
| MIN | Twins | American League Central | 3 | 77 | 85 | .475 | 8.0 | 739 | 797 | -58 | W1 |
| DET | Tigers | American League Central | 4 | 76 | 86 | .469 | 9.0 | 723 | 652 | 71 | L1 |
| KC | Royals | American League Central | 5 | 69 | 93 | .426 | 16.0 | 690 | 810 | -120 | W1 |
1. Division standings
Six tables in one, grouped by division. gt_sdv_logos turns the Stats API abbreviations into logos and
gt_color_pills draws the run differential on a scale centred at zero.
from great_tables import GT

from sdvplot.great_tables import gt_color_pills, gt_save_crop, gt_sdv_logos, gt_theme_broadsheet

table = standings.sort("division", "rank").select(
    "division", "abbreviation", "team_name", "w", "l", "pct", "gb", "rs", "ra", "diff", "strk"
)
reach = max(abs(table["diff"].min()), table["diff"].max())
gt = (
    GT(table, groupname_col="division", id="mlb-standings")  # fixed id: no random one each run
    .tab_header(f"MLB standings, {season}", f"By division, {through}")
    .cols_label(
        abbreviation="",
        team_name="Team",
        w="W",
        l="L",
        pct="Pct",
        gb="GB",
        rs="RS",
        ra="RA",
        diff="Diff",
        strk="Streak",
    )
    .tab_source_note(STATS_API)
)
gt = gt_color_pills(gt, "diff", palette=["#c84630", "#f7f7f7", "#2a7ab9"], domain=[-reach, reach], digits=0)
gt = gt_theme_broadsheet(gt_sdv_logos(gt, "abbreviation", league="mlb", height=24))
gt
gt_save_crop renders the same table to a trimmed PNG, ready to post.
gt_save_crop(gt, width=900)
2. Run differential
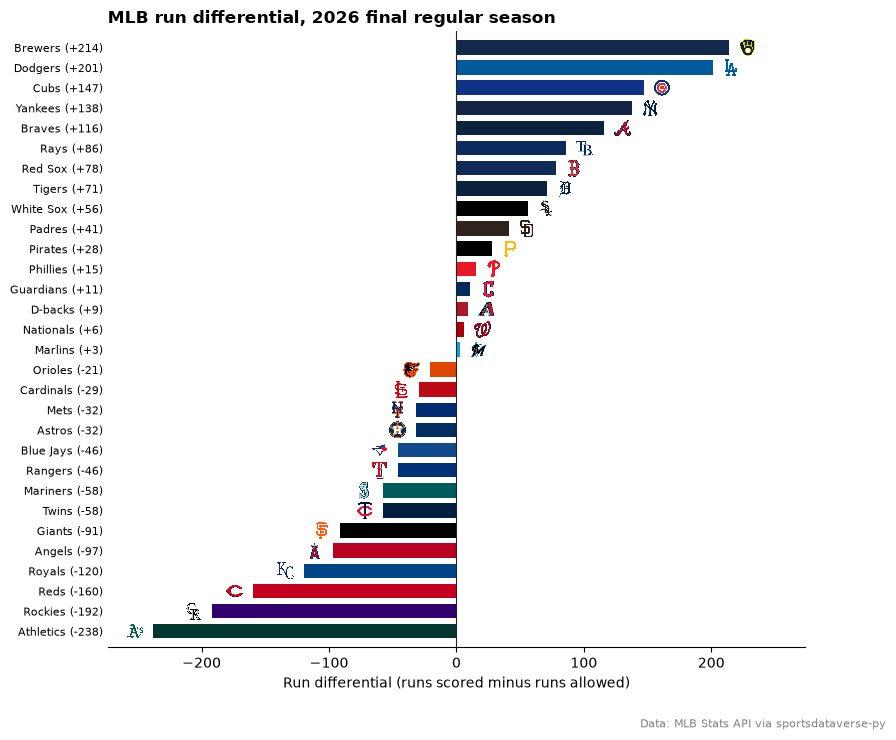
Every club's run differential as a bar in its colors, best at the top, the logo at the end of each bar.
rd = standings.sort("diff", "abbreviation")  # ties broken by name, so each re-render matches
fig, ax = plt.subplots(figsize=(9, 8))
y = list(range(rd.height))
ax.barh(y, rd["diff"], color=sdvplot.team_colors(rd["abbreviation"].to_list(), "mlb"), height=0.72)
ax.axvline(0, color="#222222", lw=0.8)
reach = max(abs(rd["diff"].min()), rd["diff"].max())
ends = [d + (0.06 if d >= 0 else -0.06) * reach for d in rd["diff"]]
ax.set_xlim(-1.15 * reach, 1.15 * reach)
ax.set_ylim(-0.8, rd.height - 0.2)
ax.set_yticks(y, [f"{name} ({d:+d})" for name, d in zip(rd["team_name"], rd["diff"], strict=True)], fontsize=8)
ax.spines[["top", "right", "left"]].set_visible(False)
ax.tick_params(axis="y", length=0)
ax.set_xlabel("Run differential (runs scored minus runs allowed)")
ax.set_title(f"MLB run differential, {season} {through}", loc="left", fontweight="bold")
fig.text(0.99, 0.01, STATS_API, ha="right", fontsize=8, color="grey")
sdvplot.add_logos(ax, ends, y, rd["abbreviation"], league="mlb", season=season, height=0.03)
plt.show()
3. League leaders with headshots
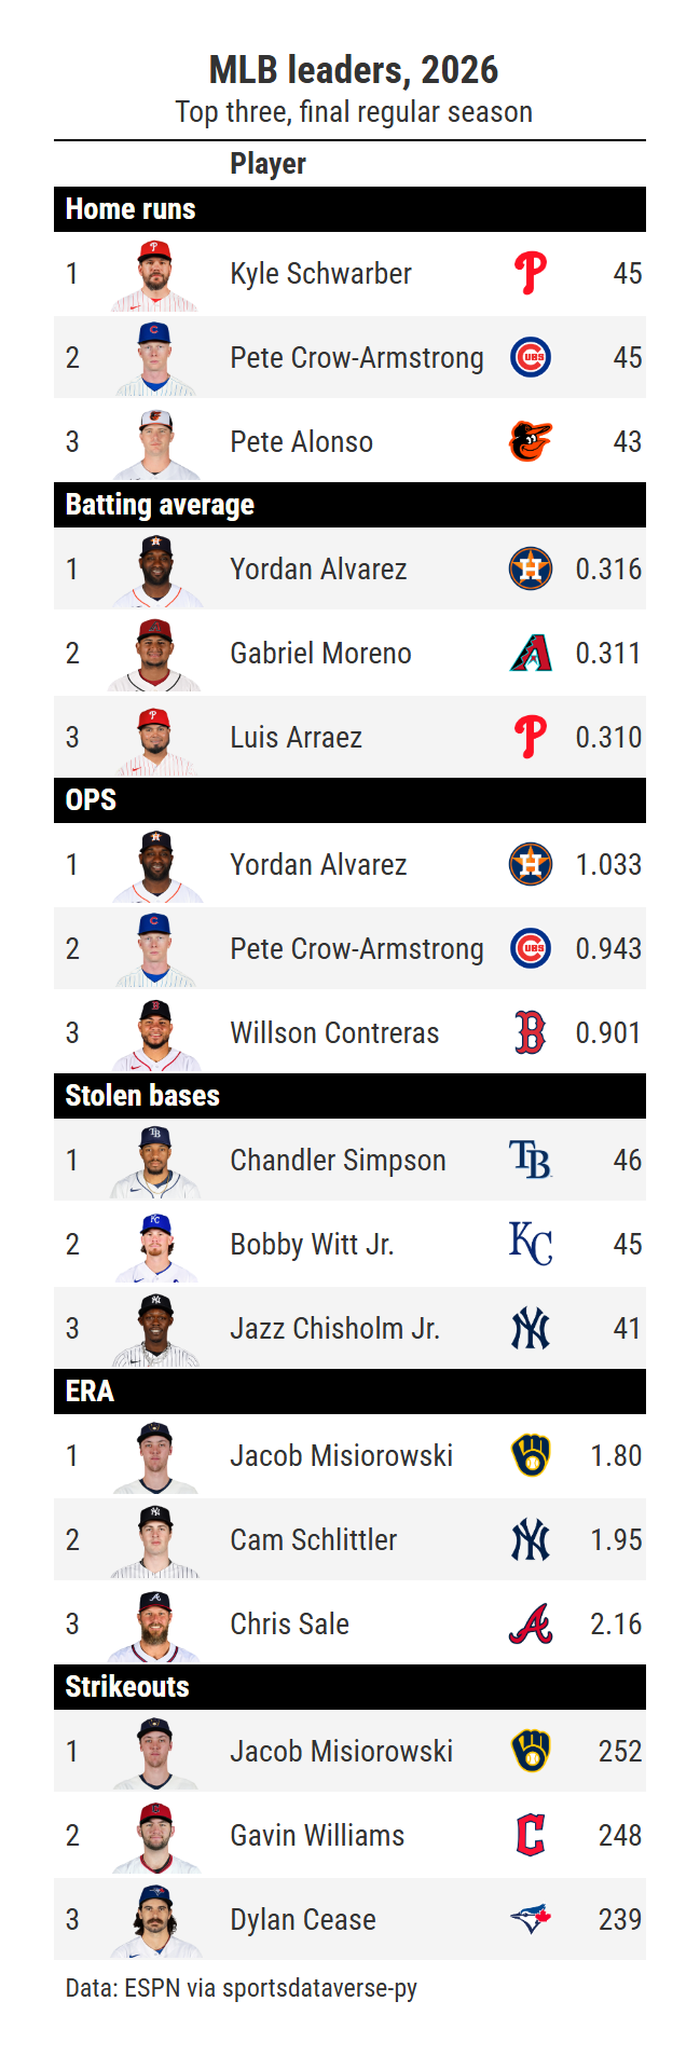
ESPN's leaders endpoint sorted by one statistic at a time (season_type=2 is the regular season; the rate stats list
qualified players). Its athlete ids feed gt_sdv_headshots and its team abbreviations feed gt_sdv_logos.
from sdvplot.great_tables import gt_sdv_headshots, gt_theme_savant

CATEGORIES = [  # (label, ESPN group, statistic, sort order, format)
    ("Home runs", "batting", "homeRuns", "desc", "{:.0f}"),
    ("Batting average", "batting", "avg", "desc", "{:.3f}"),
    ("OPS", "batting", "OPS", "desc", "{:.3f}"),
    ("Stolen bases", "batting", "stolenBases", "desc", "{:.0f}"),
    ("ERA", "pitching", "ERA", "asc", "{:.2f}"),
    ("Strikeouts", "pitching", "strikeouts", "desc", "{:.0f}"),
]
rows = []
for name, group, stat, order, fmt in CATEGORIES:
    raw = mlb.espn_mlb_leaders(
        season=season, season_type=2, sort=f"{group}.{stat}:{order}", limit=3, return_parsed=False
    )
    labels = next(c["names"] for c in raw["categories"] if c["name"] == group)
    for rank, a in enumerate(raw["athletes"], start=1):
        values = dict(zip(labels, next(c["values"] for c in a["categories"] if c["name"] == group), strict=True))
        rows.append(
            {
                "category": name,
                "rank": rank,
                "espn_id": a["athlete"]["id"],
                "player": a["athlete"]["displayName"],
                "team": a["athlete"]["teamShortName"],
                "value": fmt.format(values[stat]),
            }
        )
leaders = pl.DataFrame(rows)

leaders_gt = (
    GT(leaders, groupname_col="category", id="mlb-leaders")
    .tab_header(f"MLB leaders, {season}", f"Top three, {through}")
    .cols_label(rank="", espn_id="", player="Player", team="", value="")
    .cols_align("right", "value")
    .tab_source_note("Data: ESPN via sportsdataverse-py")
)
leaders_gt = gt_sdv_headshots(leaders_gt, "espn_id", league="mlb", height=36)
leaders_gt = gt_theme_savant(gt_sdv_logos(leaders_gt, "team", league="mlb", height=22))
leaders_gt
gt_save_crop(leaders_gt, width=700)
Run it yourself
Download the notebook (outputs cleared) or open it on GitHub.