Spring football
The XFL (2020, 2023), the USFL (2022-23), the AAF (2019) and the UFL that the XFL and USFL merged into in 2024.
These eight examples follow the franchises across leagues, then chart standings, scoring and colors. Game data comes
from ESPN's XFL and UFL feeds through sportsdataverse.football; ESPN has no USFL or AAF feed, so those two
leagues appear here through sdvplot's own team index only.
import warnings

import matplotlib.pyplot as plt
import polars as pl
from sportsdataverse.football import ufl, xfl

import sdvplot

CAPTION = "Data: ESPN via sportsdataverse-py"
SEASONS = [("xfl", 2020), ("xfl", 2023), ("ufl", 2024), ("ufl", 2025), ("ufl", 2026)]
SCOREBOARDS = {"xfl": xfl.espn_xfl_scoreboard, "ufl": ufl.espn_ufl_scoreboard}
WEEKS = {2020: 5}  # the 2020 XFL stopped after five weeks; every other season had ten

side = ["id", "display_name", "abbreviation", "color", "score"]
games = pl.concat(
    [
        SCOREBOARDS[league](dates=season, week=week, season_type=2).select(
            pl.lit(league).alias("league"),
            pl.lit(season).alias("season"),
            pl.lit(week).alias("week"),
            *[f"home_{c}" for c in side],
            *[f"away_{c}" for c in side],
        )
        for league, season in SEASONS
        for week in range(1, WEEKS.get(season, 10) + 1)
    ]
).with_columns(pl.col("home_score", "away_score").cast(pl.Int64))

# one row per team per game, from that team's side
teams = pl.concat(
    [
        games.select(
            "league",
            "season",
            "week",
            *[pl.col(f"{a}_{c}").alias(c) for c in side],
            pl.col(f"{b}_score").alias("allowed"),
        )
        for a, b in [("home", "away"), ("away", "home")]
    ]
).rename({"id": "team_id", "display_name": "name"})
records = teams.group_by("league", "season", "team_id", maintain_order=True).agg(
    name=pl.col("name").last(),
    W=(pl.col("score") > pl.col("allowed")).sum(),
    L=(pl.col("score") < pl.col("allowed")).sum(),
    PF=pl.col("score").sum(),
    PA=pl.col("allowed").sum(),
)
records.group_by("league", "season", maintain_order=True).agg(teams=pl.len(), games=pl.col("W").sum())
| league | season | teams | games |
|---|---|---|---|
| xfl | 2020 | 8 | 20 |
| xfl | 2023 | 8 | 40 |
| ufl | 2024 | 8 | 40 |
| ufl | 2025 | 8 | 40 |
| ufl | 2026 | 8 | 40 |
1. One id per franchise, across three leagues
The scoreboards come week by week (a whole-year request returns only some of the games). ESPN kept its team ids through the merger: the UFL's XFL-side teams carry their XFL ids, and its USFL-side teams the
ids ESPN gave them in the USFL. Each column below is one ESPN id, each row one league season, and add_logos with
that row's season draws the mark the team used then (the Renegades: Dallas, Arlington, Dallas again).
order = records.unique("team_id", keep="first", maintain_order=True)["team_id"].to_list()
column = {team: i for i, team in enumerate(order)}

fig, ax = plt.subplots(figsize=(10, 4.5))
for team, x in column.items():
    rows = [
        r
        for r, (league, season) in enumerate(SEASONS)
        if team in records.filter(pl.col("league") == league, pl.col("season") == season)["team_id"]
    ]
    ax.plot([x, x], [min(rows), max(rows)], color="#e3e3e3", lw=8, solid_capstyle="round", zorder=1)
for r, (league, season) in enumerate(SEASONS):
    ids = records.filter(pl.col("league") == league, pl.col("season") == season)["team_id"]
    sdvplot.add_logos(ax, [column[t] for t in ids], [r] * len(ids), ids, league=league, season=season, height=0.1)
ax.set(xlim=(-0.6, len(order) - 0.4), ylim=(len(SEASONS) - 0.5, -0.5), xticks=[])
ax.set_yticks(range(len(SEASONS)), [f"{league.upper()} {season}" for league, season in SEASONS])
ax.spines[["top", "right", "bottom", "left"]].set_visible(False)
ax.set_title("XFL and UFL teams by ESPN team id, 2020-2026", loc="left", fontweight="bold")
fig.text(0.99, 0.01, CAPTION, ha="right", fontsize=8, color="grey")
plt.show()
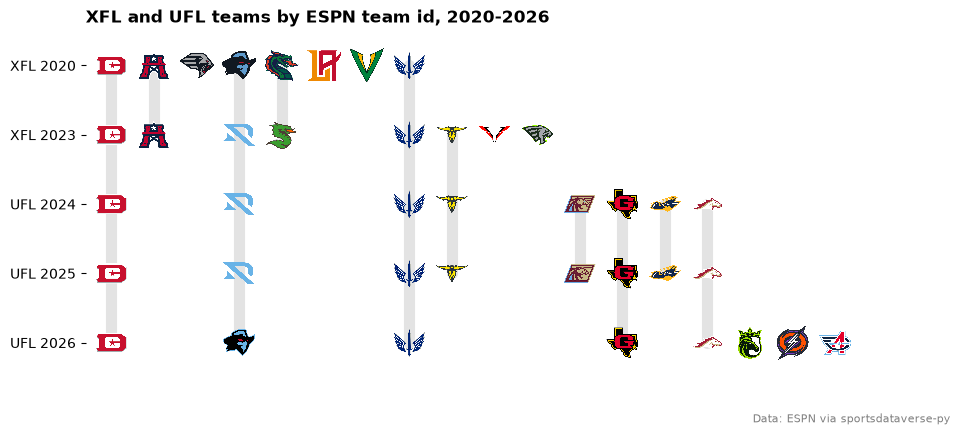
One gap shows in the Houston column: ESPN gave the 2024-25 Houston Roughnecks the id of the USFL's Houston Gamblers, and the logo archive's only mark for that id is the 2026 Gamblers logo, so 2024 and 2025 draw it too.
2. Pass ids, not abbreviations
ESPN's abbreviations changed with the teams (Birmingham was BIR in 2024 and BHAM in 2026; Arlington was ARL), and sdvplot's UFL index carries the current ones. The old abbreviations do not resolve and sdvplot warns once instead of guessing; the ids resolve every season.
ufl_2024 = teams.filter(pl.col("league") == "ufl", pl.col("season") == 2024).unique("team_id").sort("name")

with warnings.catch_warnings(record=True) as caught:
    warnings.simplefilter("always")
    by_abbreviation = sdvplot.resolve(ufl_2024["abbreviation"], "ufl", season=2024)
print(caught[0].message)

ufl_2024.select("name", "abbreviation", "team_id").with_columns(
    by_abbreviation=by_abbreviation, by_id=sdvplot.resolve(ufl_2024["team_id"], "ufl", season=2024)
)
5 value(s) did not resolve to a ufl team: 'ARL' (unknown), 'BIR' (unknown), 'MEM' (unknown), 'MIC' (unknown), 'SA' (unknown). Use sdvplot.suggest() for candidates, or strict=True to raise.
| name | abbreviation | team_id | by_abbreviation | by_id |
|---|---|---|---|---|
| Arlington Renegades | ARL | 112647 | null | 112647 |
| Birmingham Stallions | BIR | 126073 | null | 126073 |
| D.C. Defenders | DC | 112646 | 112646 | 112646 |
| Houston Roughnecks | HOU | 126075 | 126075 | 126075 |
| Memphis Showboats | MEM | 129043 | null | 129043 |
| Michigan Panthers | MIC | 125957 | null | 125957 |
| San Antonio Brahmas | SA | 126746 | null | 126746 |
| St. Louis Battlehawks | STL | 112651 | 112651 | 112651 |
3. A standings table
The 2026 UFL table with great_tables: gt_sdv_logos for the logos, gt_color_pills for the point differential and
the broadcast-style gt_theme_scoreboard.
from great_tables import GT

from sdvplot.great_tables import gt_color_pills, gt_sdv_logos, gt_theme_scoreboard

table = (
    records.filter(pl.col("league") == "ufl", pl.col("season") == 2026)
    .with_columns(Diff=pl.col("PF") - pl.col("PA"))
    .sort(["W", "Diff"], descending=True)
    .select(logo="team_id", team="name", W="W", L="L", PF="PF", PA="PA", Diff="Diff")
)
limit = table["Diff"].abs().max()  # pills colored on a scale centered on zero

(
    GT(table)
    .pipe(gt_sdv_logos, "logo", league="ufl", season=2026, height=28)
    .pipe(gt_color_pills, "Diff", digits=0, domain=[-limit, limit])
    .cols_label(logo="", team="")
    .tab_header(title="UFL standings, 2026", subtitle="Regular season")
    .tab_source_note(CAPTION)
    .pipe(gt_theme_scoreboard)
)
4. Every UFL season, points for and against
Points scored and allowed per game, one panel per season. add_logos takes the panel's season, so the Renegades
change marks between 2025 and 2026 and the 2026 expansion teams appear only in the last panel.
ufl_seasons = records.filter(pl.col("league") == "ufl").with_columns(
    pf=pl.col("PF") / (pl.col("W") + pl.col("L")), pa=pl.col("PA") / (pl.col("W") + pl.col("L"))
)

fig, axes = plt.subplots(1, 3, figsize=(10, 4.2), sharex=True, sharey=True)
for ax, (season, rows) in zip(axes, ufl_seasons.group_by("season", maintain_order=True), strict=True):
    season = season[0]
    ax.axline((20, 20), slope=1, color="#cccccc", lw=0.8, ls="--")
    ax.scatter(rows["pf"], rows["pa"], s=0)
    sdvplot.add_logos(ax, rows["pf"], rows["pa"], rows["team_id"], league="ufl", season=season, height=0.14)
    ax.set_title(str(season), fontweight="bold")
    ax.set_xlabel("Points per game")
axes[0].set_ylabel("Points allowed per game")
axes[0].set(xlim=(12, 30), ylim=(30, 12))  # allowed flipped: better defenses higher
fig.suptitle("UFL scoring and defense by season", x=0.01, ha="left", fontweight="bold")
fig.text(0.99, 0.01, f"{CAPTION} | dashed line: scored = allowed", ha="right", fontsize=8, color="grey")
fig.tight_layout()
plt.show()

5. Scoring across leagues with plotnine
Total points in every regular-season game, by league season, from the same scoreboards.
from plotnine import (
    aes,
    geom_boxplot,
    geom_jitter,
    ggplot,
    labs,
    scale_fill_manual,
    scale_x_discrete,
    theme,
    theme_minimal,
)

totals = games.with_columns(
    total=pl.col("home_score") + pl.col("away_score"),
    label=pl.format("{} {}", pl.col("league").str.to_uppercase(), pl.col("season")),
)

(
    ggplot(totals.to_pandas(), aes("label", "total", fill="league"))
    + geom_boxplot(outlier_shape="", width=0.5, alpha=0.6)
    + geom_jitter(width=0.12, height=0, size=1.2, alpha=0.5, random_state=1)
    + scale_fill_manual({"xfl": "#b8b8b8", "ufl": "#4a7fb5"})
    + scale_x_discrete(limits=[f"{league.upper()} {season}" for league, season in SEASONS])  # in time order
    + labs(
        x="",
        y="Points per game (both teams)",
        title="Total points per game in spring football",
        caption=f"{CAPTION} | regular season",
    )
    + theme_minimal()
    + theme(figure_size=(9, 5), legend_position="none")
)

6. An interactive Plotly chart
Each 2026 UFL team's running point differential, in its colors from team_colors, with the logos at the end of the
lines and hover text on every week.
import plotly.graph_objects as go

running = (
    teams.filter(pl.col("league") == "ufl", pl.col("season") == 2026)
    .sort("week")
    .with_columns(running=(pl.col("score") - pl.col("allowed")).cum_sum().over("team_id"))
)

fig = go.Figure()
for (team_id, name), rows in running.group_by("team_id", "name", maintain_order=True):
    fig.add_trace(
        go.Scatter(
            x=rows["week"],
            y=rows["running"],
            mode="lines+markers",
            name=name,
            line={"color": sdvplot.team_colors(team_id, "ufl", season=2026), "width": 2},
            hovertemplate=f"{name}<br>week %{{x}}: %{{y:+d}}<extra></extra>",
        )
    )
fig.update_layout(
    title="UFL 2026: running point differential",
    xaxis={"title": "Week", "range": [0.5, 11.2]},
    yaxis_title="Point differential",
    showlegend=False,
    template="plotly_white",
    width=800,
    height=500,
)
ends = running.group_by("team_id", maintain_order=True).last().sort("running")
spots = ends["running"].to_list()
for i in range(1, len(spots)):  # nudge the logos apart where teams finished close together
    spots[i] = max(spots[i], spots[i - 1] + 13)
sdvplot.add_logos(fig, ends["week"] + 0.6, spots, ends["team_id"], league="ufl", season=2026, height=0.085)
fig
7. When sdvplot has only a fallback color
Most spring-league colors in the index are fallbacks (color_source == "fallback"): colors from a colorblind-safe
palette that keep teams apart but are not theirs. ESPN's scoreboard ships each team's own color (the color column
loaded above), so this chart of the 2023 XFL takes its colors from the data and its logos from sdvplot.
sdvplot.teams("xfl").select("team_id", "name", "color_primary", "color_source").head(4)
| team_id | name | color_primary | color_source |
|---|---|---|---|
| 112646 | DC Defenders | #4e79a7 | fallback |
| 112647 | Arlington Renegades | #b07aa1 | fallback |
| 112648 | Houston Roughnecks | #76b7b2 | fallback |
| 112649 | Los Angeles Wildcats | #edc948 | fallback |
xfl_2023 = (
    records.filter(pl.col("league") == "xfl", pl.col("season") == 2023)
    .join(teams.select("team_id", "color").unique("team_id"), on="team_id")
    .with_columns(color="#" + pl.col("color"))
    .sort("W", descending=True)
)

fig, ax = plt.subplots(figsize=(8, 4.5))
ax.bar(xfl_2023["team_id"], xfl_2023["W"], color=xfl_2023["color"].to_list())
sdvplot.axis_logos(ax, "x", league="xfl", season=2023, height=0.12)
ax.set_ylabel("Wins")
ax.spines[["top", "right"]].set_visible(False)
ax.set_title("XFL 2023 regular season wins, in ESPN's team colors", loc="left", fontweight="bold")
fig.subplots_adjust(bottom=0.2)  # room for the logos under the axis, above the caption
fig.text(0.99, 0.01, CAPTION, ha="right", fontsize=8, color="grey")
plt.show()

8. The USFL and the AAF: logos without game data
ESPN has no feed for the 2022-23 USFL or the 2019 AAF, and sportsdataverse has no free source for them (its AAF
module reads PFF, which needs a key). sdvplot still knows both leagues' teams and marks, so a chart that brings its
own data can use them; here they are, from teams alone.
import textwrap

fig, axes = plt.subplots(2, 1, figsize=(10, 3.6))
for ax, (league, season, title) in zip(
    axes, [("usfl", None, "USFL, 2022-2023"), ("aaf", 2019, "AAF, 2019")], strict=True
):
    index = sdvplot.teams(league).sort("name")
    xs = list(range(index.height))
    sdvplot.add_logos(ax, xs, [0.62] * index.height, index["team_id"], league=league, season=season, height=0.5)
    for x, name in zip(xs, index["name"], strict=True):
        ax.text(x, 0.08, textwrap.fill(name, 11, break_long_words=False), ha="center", va="bottom", fontsize=7)
    ax.set(xlim=(-0.6, 8.6), ylim=(0, 1), title=title)
    ax.axis("off")
fig.text(0.99, 0.01, "Teams and marks: sdvplot team index and logo archive", ha="right", fontsize=8, color="grey")
plt.show()

Run it yourself
Download the notebook (outputs cleared) or open it on GitHub.