Logos and eras
A franchise changes marks over time. logo_url and logo_image take a season and return the mark in use that
year.
import sdvplot
sdvplot.logo_url("LV", "nfl"), sdvplot.logo_url("OAK", "nfl", season=2010)
('https://sdv.nyc3.cdn.digitaloceanspaces.com/assets/public/sha256/25/25fbb03e972ae872fa024026b73c7b63ef9f23c2f2c51f87d1614d800dcee6e7.png',
 'https://sdv.nyc3.cdn.digitaloceanspaces.com/assets/public/sha256/94/94de716ea6d3859effbfbc0966c8327eefc0a004e0d2f16c77ca80b58fd95eaa.png')
The marks table
The marks table lists every mark with the seasons it is valid for. Sorted by valid_from, the dated Oakland-era marks
(1960-2019) come first; marks with no dates are the current ones.
(
    sdvplot.marks("LV", "nfl")
    .sort("valid_from", nulls_last=True)
    .select("entity_name", "variant", "mark_type", "valid_from", "valid_to", "source")
    .head(8)
)
| entity_name | variant | mark_type | valid_from | valid_to | source |
|---|---|---|---|---|---|
| OAK | dark | logo | 1960 | 2019 | espn |
| OAK | default | logo | 1960 | 2019 | espn |
| Oakland Raiders | squared | logo | 1960 | 2019 | nflverse |
| Oakland Raiders | default | wordmark | 1960 | 2019 | nflverse |
| Las Vegas Raiders | primary_logo_on_white_color | logo | null | null | espn |
| Las Vegas Raiders | secondary_logo_on_white_color | logo | null | null | espn |
| Las Vegas Raiders | primary_logo_white | logo | null | null | espn |
| Las Vegas Raiders | secondary_logo_white | logo | null | null | espn |
Logos by season
logo_image returns a PIL image (or None when no mark exists), so it drops straight into imshow. Here are the Raiders in 2010, 2019 and 2024.
import matplotlib.pyplot as plt

fig, axes = plt.subplots(1, 3, figsize=(9, 3))
for ax, s in zip(axes, (2010, 2019, 2024), strict=True):
    ax.imshow(sdvplot.logo_image("LV", "nfl", season=s, size=200))
    ax.set_title(str(s))
    ax.axis("off")
plt.show()
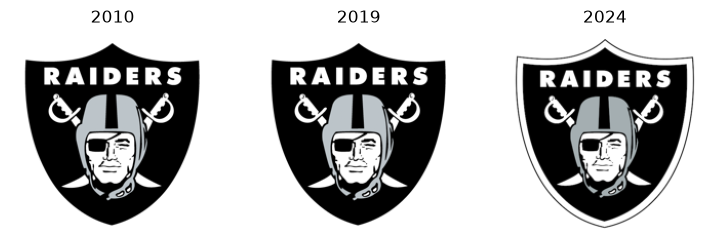
2010 and 2019 are the same Oakland mark (valid 1960-2019); the Las Vegas mark starts after that.
SVG marks
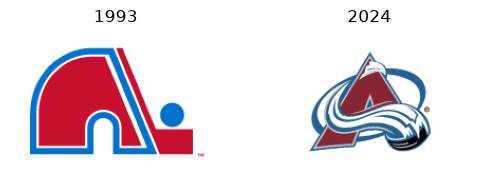
NHL marks are SVGs, rasterized by the svg extra. The Avalanche moved from Quebec in 1995, so 1993 is the Nordiques mark.
fig, axes = plt.subplots(1, 2, figsize=(6, 3))
for ax, s in zip(axes, (1993, 2024), strict=True):
    ax.imshow(sdvplot.logo_image("COL", "nhl", season=s, size=200))
    ax.set_title(str(s))
    ax.axis("off")
plt.show()
How era selection works
Each mark carries valid_from / valid_to seasons (inclusive), or none. With a season, sdvplot picks, within the
requested variant, a mark with explicit dates that cover the season first, then an undated mark, and only then any
other row. Without a season you get the current (undated) mark. See Seasons and eras for the full rules.
Run it yourself
Download the notebook (outputs cleared) or open it on GitHub.